Forex Equity & Balance Tracker Free Indicator for MT4 & MT5
Track Your Forex Account Balance and Equity Visually
Keeping track of your trading account performance can be difficult when you are managing multiple trades, especially if you want to see how your account balance and equity have changed over time.
The EA Trades Equity & Balance Tracker is a free Forex trading indicator designed to give traders a clear visual representation of their historical balance curve and equity curve directly inside MetaTrader.
The indicator is available completely free for MT4 and MT5, making it a useful tool for Forex traders who want a simple way to analyze account performance without manually calculating historical results.
What Is a Forex Equity Curve?
An equity curve is a visual representation of how your trading account equity changes over time.
Unlike simply looking at your current account balance, an equity curve can help you understand:
- How your account has performed historically
- Periods of growth and decline
- The effect of open trades on account equity
- Maximum and minimum account values
- Whether your trading performance has been relatively smooth or volatile
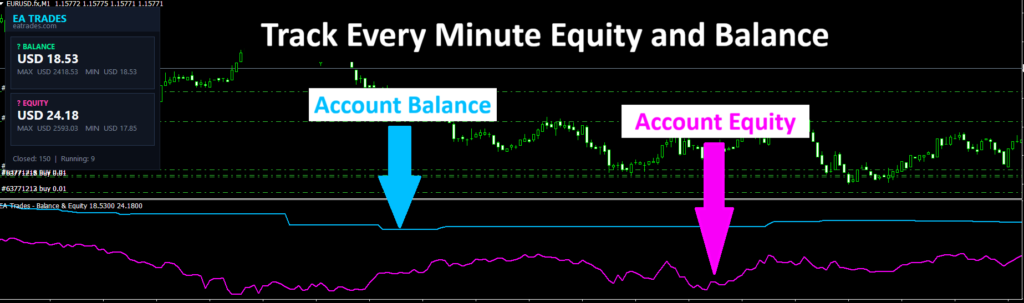
The EA Trades Equity & Balance Tracker displays both the Balance Curve and Equity Curve so you can compare realized trading performance with the value of your account including open positions.
Balance vs Equity in Forex Trading
Understanding the difference between balance and equity is important for every Forex trader.
Balance represents the account value after closed trades and other completed account transactions.
Equity represents the current value of the account, including the floating profit or loss from open trades.
For example, if your account balance is $10,000 and your currently open trades have a floating loss of $300:
Balance = $10,000
Equity = $9,700
The difference between these two values can provide useful information about your current exposure and floating profit or loss.
Key Features of the Free Equity & Balance Tracker
Historical Balance Curve
The indicator reconstructs the historical account balance and displays it as a line on the indicator window.
This allows you to visually examine how your account balance developed as trades were closed.
Historical Equity Curve
The indicator also calculates an equity curve using your trading history and open positions.
This can help you identify periods where floating profits or losses significantly affected your account.
🔵 Balance and 🟣 Equity Lines
The two curves are displayed separately, making it easy to compare them visually.
You can quickly see when equity moves away from balance because of open positions and floating P/L.
Maximum and Minimum Values
The built-in dashboard displays:
- Current Balance
- Maximum Balance
- Minimum Balance
- Current Equity
- Maximum Equity
- Minimum Equity
This gives you a quick overview of your account’s historical range.
Closed and Running Trade Count
The dashboard also shows the number of:
- Closed trades
- Currently running trades
This makes the indicator useful when reviewing an account with a large number of historical positions.
Trading Dashboard
Instead of displaying only two lines, the indicator includes a modern dark dashboard with a clean trading-style interface.
The panel is designed to provide important account information without taking up excessive chart space.
Useful for Forex Strategy Analysis
The Equity & Balance Tracker can be particularly useful when evaluating an Expert Advisor (EA), Forex strategy, scalping system, hedging system, grid strategy, or manual trading approach.
For example, traders can use the indicator to visually inspect whether an account experienced:
- Consistent growth
- Large equity fluctuations
- Significant floating drawdowns
- Periods of stagnation
- Sharp increases or decreases in account value
This can provide additional information beyond simply looking at the final account balance.
Free MT4 & MT5 Indicator
The EA Trades Equity & Balance Tracker is available for both major MetaTrader platforms:
- MetaTrader 4 (MT4)
- MetaTrader 5 (MT5)
You can use the appropriate version depending on your trading platform.
There is no paid subscription or premium upgrade required to use the free indicator.
How to Use the Indicator
Using the indicator is simple:
- Download the MT4 or MT5 version.
- Install the indicator into your MetaTrader platform.
- Restart MetaTrader or refresh the Navigator.
- Open the account/chart where you want to analyze performance.
- Attach EA Trades – Equity & Balance Tracker to the chart.
- Allow the indicator to process your available trading history.
Once loaded, the indicator will display the historical balance and equity curves together with the account performance dashboard.
Important:
Before loading the indicator to chart, you must go to your trading account history and show all history. If the history is shown for lesser time period, the indicator can show only lesser information on chart.
Frequently Asked Questions
Is the Equity & Balance Tracker free?
Yes. The indicator is provided free by EA Trades and is available for both MT4 and MT5.
Does it work with MT4?
Yes. A dedicated MT4 version is available.
Does it work with MT5?
Yes. A dedicated MT5 version is available.
Does the indicator show historical balance?
Yes. The indicator calculates and displays a historical balance curve based on the available trading history.
Does it show equity?
Yes. It displays an equity curve that incorporates the effect of open trades and their floating profit or loss.
Can I use it with Forex Expert Advisors?
Yes. It can be used to visually analyze accounts running Expert Advisors as well as manually traded accounts.