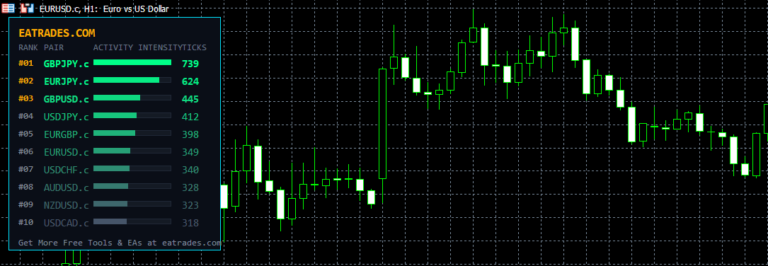
Forex Trend Indicator Free Download
Finding the real market trend is one of the most important parts of successful Forex trading. Many traders spend valuable time switching between multiple charts and timeframes to determine whether a currency pair is trending up, trending down, or moving sideways.
Our Free Forex Trend Indicator for MetaTrader 4 (MT4) and MetaTrader 5 (MT5) eliminates this hassle by displaying the trend direction and trend strength of multiple currency pairs across multiple timeframes on a single chart.
The indicator combines ADX (Average Directional Index), Moving Averages, and RSI (Relative Strength Index) to perform advanced calculations and determine the current market trend with a percentage-based strength value. Instead of checking each chart individually, you can instantly view the overall market trend and make faster, more informed trading decisions.
Best of all, this indicator is 100% free, requires no license, and is available for instant download.
Download Free Forex Trend Indicator
What Is the Forex Trend Indicator?
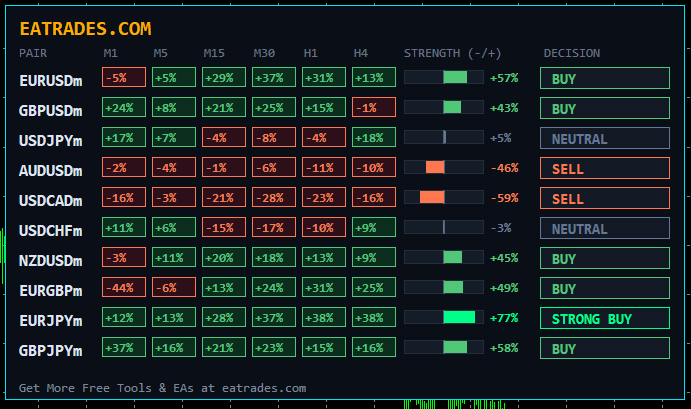
The Forex Trend Indicator is a powerful MT4 and MT5 tool that analyzes multiple trading symbols across multiple timeframes and displays the current market trend in one easy-to-read dashboard.
Instead of relying on a single indicator or timeframe, it combines the results from several technical indicators to calculate a trend strength percentage for every timeframe.
The indicator then combines those results to generate a final Buy or Sell trend percentage for each currency pair.
This allows traders to quickly identify strong market trends without manually analyzing dozens of charts.
Key Features
- Completely free to download and use
- Supports both MT4 and MT5
- Displays multiple currency pairs on one chart
- Monitors multiple timeframes simultaneously
- Uses ADX, Moving Average, and RSI
- Shows Buy and Sell trend strength in percentages
- Calculates an overall trend decision automatically
- Automatically detects broker prefixes and suffixes
- Fast, lightweight, and beginner-friendly
- No activation or license required
How the Indicator Works
The indicator continuously collects price data from every selected currency pair and analyzes multiple timeframes, including:
- M1
- M5
- M15
- M30
- H1
- H4
For every timeframe, the indicator performs advanced calculations using:
- Average Directional Index (ADX)
- Moving Average
- Relative Strength Index (RSI)
Each timeframe receives its own Buy or Sell strength percentage.
The indicator then combines all timeframe results to calculate a final overall trend percentage, helping traders quickly identify the strongest buying or selling opportunities.
Trend Interpretation
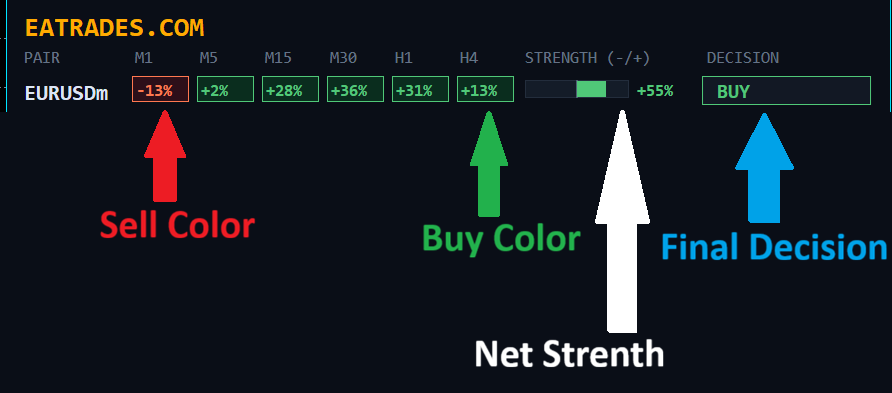
Buy trend percentages are displayed in green, while Sell trend percentages are displayed in red for quick visual analysis.
Why Use This Indicator?
Analyzing several currency pairs and multiple timeframes manually takes time and increases the chance of missing trading opportunities.
The Forex Trend Indicator helps traders by:
- Saving time
- Monitoring multiple symbols simultaneously
- Displaying all timeframe trends on one screen
- Identifying strong market trends quickly
- Helping traders avoid conflicting timeframe signals
- Supporting better trade confirmation
- Simplifying technical analysis
Whether you are a beginner or an experienced trader, this indicator provides a clear overview of market direction.
Input Parameters
Trading Symbols
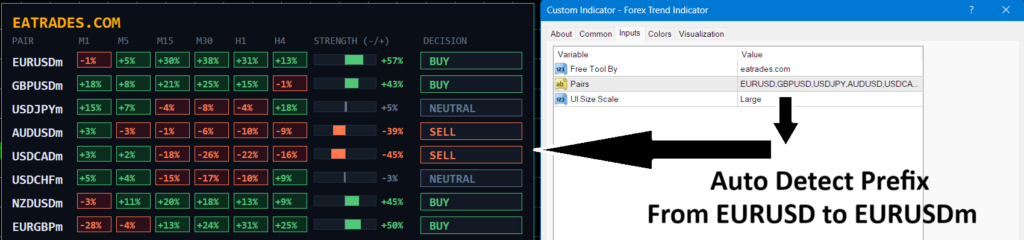
Enter the currency pairs you want to monitor using commas to separate each symbol.
Example: EURUSD,GBPUSD,USDJPY,AUDUSD,USDCAD
There is no need to include your broker’s symbol prefixes or suffixes.
For example, if your broker uses: EURUSDm or GBPUSD.pro
The indicator automatically detects broker-specific prefixes and suffixes.
Does the Indicator Repaint?
No.
The Forex Trend Indicator does not predict future price movements, so repainting is not relevant.
Instead, it analyzes current market data and displays the existing trend strength based on live market conditions.
As market conditions change, the displayed percentages update accordingly, giving traders an accurate view of the current trend rather than attempting to forecast future prices.
Who Can Use This Indicator?
This indicator is suitable for:
- Forex beginners
- Scalpers
- Day traders
- Swing traders
- Trend-following traders
- Manual traders
- Forex EA users
- Professional traders
How to Install
Installing the indicator takes only a few minutes.
- Download the MT4 or MT5 version.
- Open MetaTrader.
- Click File → Open Data Folder.
- Open MQL4 → Indicators (or MQL5 → Indicators for MT5).
- Copy the downloaded indicator file into the Indicators folder.
- Restart MetaTrader.
- Drag the indicator onto any chart.
Video Explaination
How the Forex Trend Indicator Calculates Trend Signals
The Forex Trend Indicator combines real-time momentum, institutional trend filtering, and directional volatility analysis to generate actionable trading signals. Below is the exact quantitative mathematical model used to analyze multi-timeframe market structure.
1. Core Technical Indicator Calculations
A. Relative Strength Index (RSI – 14 Period)
RSI measures directional momentum across each timeframe. First, price change (ΔP) is calculated per candle:
Using Wilder’s Smoothing over 14 periods, average gains and losses are derived:
AvgLosst = [(AvgLosst-1 × 13) + Losst] / 14
The Relative Strength (RS) and raw 14-period RSI are determined:
RSI = 100 – [ 100 / (1 + RS) ]
To convert RSI into a usable score, its deviation from the 50 mid-level is scaled using a 3.5× multiplier:
B. Exponential Moving Average (EMA – 200 Period H1 Filter)
The 200 EMA on the H1 timeframe acts as a structural macro filter. The weighting multiplier (K) for period N = 200 is:
The 200 EMA is computed sequentially:
Filter Rule: When H1 price is above the 200 EMA and the total score is bullish (Score > 0), the total score receives a 1.20× multiplier (+20% boost). The same boost applies when price is below the 200 EMA and score is bearish (Score < 0).
C. Average Directional Index (ADX – 14 Period)
ADX measures trend strength independent of direction. Directional movement (+DM, -DM) and True Range (TR) are evaluated:
DownMove = Lowt-1 – Lowt
TR = Max( Hight – Lowt, |Hight – Closet-1|, |Lowt – Closet-1| )
Directional Indicators (+DI14, -DI14) and the Directional Index (DX) are computed:
-DI14 = 100 × [ Smoothed(-DM) / Smoothed(TR) ]
DX = 100 × [ |(+DI14) – (-DI14)| / ((+DI14) + (-DI14)) ]
Final ADX is smoothed over 14 periods:
2. Institutional Timeframe Weighting Model
Higher timeframes dominate order flow structure. Each timeframe (t) is assigned an institutional weight coefficient (Wt):
| Timeframe | Weight Coefficient (Wt) |
|---|---|
| M1 | 0.5 |
| M5 | 0.8 |
| M15 | 1.2 |
| M30 | 2.0 |
| H1 | 3.5 |
| H4 | 5.0 |
The base weighted score across all 6 timeframes is calculated as:
(Where Σ Wt = 0.5 + 0.8 + 1.2 + 2.0 + 3.5 + 5.0 = 13.0)
3. Final Decision Matrix & Threshold Rules
After aggregating multi-timeframe scores, adding confluence bonuses (+5% per agreeing timeframe when ≥4 timeframes align), and applying the 200 EMA boost, the total score is clamped between -100% and +100% to assign the final signal output:
| Final Score Range | Decision Output | Market Interpretation & Execution Rule |
|---|---|---|
| +60% to +100% | STRONG BUY | High-probability bullish trend. Confluence above 60% with H1 200 EMA support. |
| +10% to +59% | BUY | Moderate bullish bias (greater than 10%, less than 60%). Suitable for pullback entries. |
| -9% to +9% | NEUTRAL | No actionable direction (score less than 10%). Market is ranging or in consolidation. |
| -10% to -59% | SELL | Moderate bearish bias (greater than 10%, less than 60%). Suitable for short entries on rallies. |
| -60% to -100% | STRONG SELL | High-probability bearish trend. Confluence below 60% with H1 200 EMA resistance. |
Frequently Asked Questions
Is this indicator free?
Yes. It is completely free with no hidden charges or subscription fees.
Does it work on MT4 and MT5?
Yes. Separate versions are available for MetaTrader 4 and MetaTrader 5.
Does it predict future trends?
No. It analyzes the current market trend using live market data and technical indicators.
Does it repaint?
No. The indicator displays current market conditions and updates as new market data becomes available.
Can I monitor multiple currency pairs?
Yes. You can monitor multiple Forex pairs simultaneously from one dashboard.
Can I change the list of trading pairs?
Yes. Simply edit the Trading Symbols input parameter.
Does it support broker suffixes and prefixes?
Yes. The indicator automatically detects them.
Do I need a license?
No. The indicator is completely free and requires no activation or license key.
Lifetime Free License
The Forex Trend Indicator is provided free of charge by EA Trades.
There are:
- No activation keys
- No monthly subscriptions
- No hidden fees
- No expiration date
- No usage limitations
Simply download the indicator and use it for as long as you like.