Multi Timeframe Forex Trend Indicator – Free Download MT4 & MT5
The Multi Timeframe Forex Trend Indicator is a free technical analysis tool designed to help Forex traders understand the current market trend more easily.
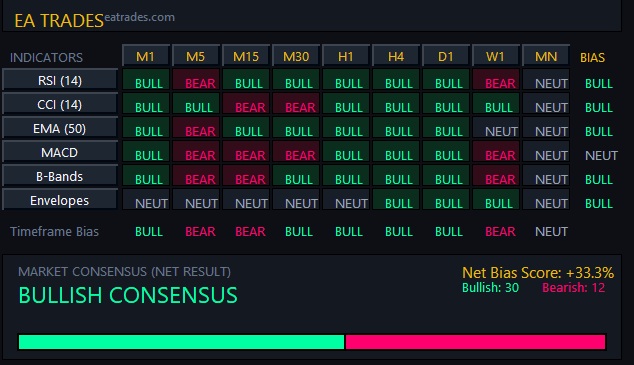
Instead of checking multiple indicators and timeframes manually, this indicator combines 6 popular technical indicators across 9 different timeframes and displays the results in a single dashboard.
The indicator analyzes 6 technical indicators (RSI, CCI, EMA 50, MACD, Bollinger Bands, and Envelopes) across 9 timeframes (M1, M5, M15, M30, H1, H4, D1, W1, and MN), providing up to 54 individual market signals in one dashboard.
This gives traders a quick overview of the current bullish, bearish, or neutral conditions across the market.
The Multi Timeframe Forex Trend Indicator is completely free and available for both MetaTrader 4 (MT4) and MetaTrader 5 (MT5).
Important: This indicator does not predict the future. It analyzes current market data and technical conditions to show the current trend and technical bias. Market conditions can change at any time.
Touchscreen ON/OFF Controls for Timeframes and Indicators
One of the most useful features of the Multi Timeframe Forex Trend Indicator is its interactive touchscreen-style dashboard.
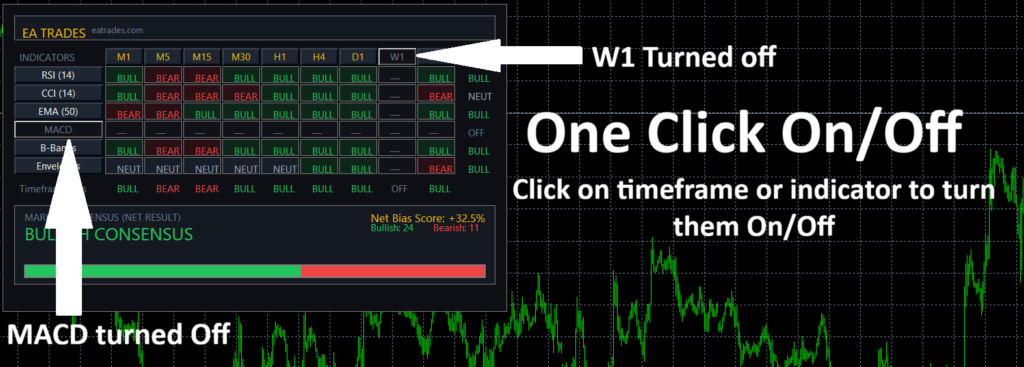
You can turn any timeframe or any technical indicator ON or OFF directly from the dashboard with a simple click or touch.
Turn Any Timeframe ON or OFF
The dashboard provides individual controls for all 9 timeframes:
- M1
- M5
- M15
- M30
- H1
- H4
- D1
- W1
- MN
If you don’t want a particular timeframe to influence the overall market analysis, simply touch or click its timeframe button to turn it OFF.
For example, you can disable M1, M5, and M15 if you want your trend analysis to focus mainly on H1, H4, D1, W1, and MN.
When a timeframe is turned OFF, its signals are excluded from the overall consensus calculation.
Turn Any Indicator ON or OFF
You can also independently control each of the six technical indicators:
- RSI
- CCI
- EMA 50
- MACD
- Bollinger Bands
- Envelopes
Simply touch or click the indicator button to turn it ON or OFF.
For example, you can disable Bollinger Bands and Envelopes while keeping RSI, CCI, EMA, and MACD active.
This gives you complete control over which timeframes and indicators are included in the trend analysis.
Build Your Own Trend Analysis
Because both timeframes and indicators can be individually enabled or disabled, you can customize the dashboard according to your own trading style.
For example:
Timeframes ON: H1, H4, D1, W1, MN
Timeframes OFF: M1, M5, M15, M30
Indicators ON: RSI, CCI, EMA, MACD
Indicators OFF: Bollinger Bands, Envelopes
The dashboard immediately updates its calculations based on your selections.
This makes the indicator more than a static trend indicator — it is an interactive multi-timeframe Forex trend analysis dashboard that lets you control exactly which market conditions are included in the final consensus.
What Is a Multi Timeframe Forex Trend Indicator?
A Multi Timeframe Forex Trend Indicator is a technical analysis tool that examines market conditions across multiple chart timeframes.
Instead of looking only at the current chart timeframe, the indicator allows you to see what different timeframes are showing at the same time.
For example, the short-term timeframes may show a bearish trend while the higher timeframes remain bullish.
A dashboard like this can help traders quickly identify whether the market is generally aligned in one direction or whether different timeframes are showing conflicting signals.
The Multi Timeframe Forex Trend Indicator takes this concept further by combining six different technical indicators across nine timeframes.
Analyze 6 Indicators Across 9 Timeframes
When all filters are enabled, the indicator can evaluate up to:
6 indicators × 9 timeframes = 54 individual technical signals
These signals are presented in a visual matrix so traders can quickly see where bullish and bearish conditions are appearing.
Each signal is classified as:
BULL – The indicator currently shows a bullish condition.
BEAR – The indicator currently shows a bearish condition.
NEUT – The indicator does not show a clear bullish or bearish condition.
The dashboard then summarizes these results to produce timeframe biases, indicator biases, and an overall market consensus.
Technical Indicators Used by the Multi Timeframe Forex Trend Indicator
1. RSI – Relative Strength Index
The Relative Strength Index (RSI) is used to evaluate current market momentum.
The default RSI period is 14.
The indicator uses the 50 level as the directional reference:
- RSI above 50 = BULL
- RSI below 50 = BEAR
- RSI at 50 = NEUT
This means the RSI section is primarily being used to identify the current momentum bias rather than traditional overbought and oversold conditions.
2. CCI – Commodity Channel Index
The Commodity Channel Index (CCI) is another momentum indicator included in the dashboard.
The default CCI period is 14.
The indicator evaluates CCI around the zero level:
- CCI above 0 = BULL
- CCI below 0 = BEAR
- CCI at 0 = NEUT
Using CCI together with RSI provides another measurement of the current market momentum.
3. EMA 50 – Exponential Moving Average
The indicator uses a 50-period Exponential Moving Average (EMA) to compare the current market price with the moving average.
The calculation is straightforward:
- Price above EMA 50 = BULL
- Price below EMA 50 = BEAR
- Price equal to EMA 50 = NEUT
The EMA provides a trend-oriented reference that can be compared across different timeframes.
4. MACD
The Multi Timeframe Forex Trend Indicator also includes the Moving Average Convergence Divergence (MACD) indicator.
The default settings are:
- Fast EMA: 12
- Slow EMA: 26
- Signal: 9
The dashboard compares the MACD main line with the signal line:
- MACD Main above Signal = BULL
- MACD Main below Signal = BEAR
- MACD Main equal to Signal = NEUT
This provides another view of current momentum and directional conditions.
5. Bollinger Bands
Bollinger Bands are also included in the multi-timeframe analysis.
The default settings are:
- Period: 20
- Deviation: 2.0
The indicator uses the middle Bollinger Band as the reference:
- Price above middle band = BULL
- Price below middle band = BEAR
- Price at middle band = NEUT
This allows the dashboard to compare the current market price with the Bollinger Band midpoint.
6. Envelopes
The sixth indicator is Envelopes.
The default settings are:
- Period: 14
- Deviation: 0.1%
The indicator checks whether the current price is outside the upper or lower envelope:
- Price above upper envelope = BULL
- Price below lower envelope = BEAR
- Price inside the envelopes = NEUT
When price remains inside the envelopes, the indicator does not force a bullish or bearish signal.
Multi Timeframe Forex Analysis
One of the main advantages of this Forex Trend Indicator is its ability to analyze multiple timeframes simultaneously.
The dashboard supports:
| Timeframe | Description |
|---|---|
| M1 | 1 Minute |
| M5 | 5 Minutes |
| M15 | 15 Minutes |
| M30 | 30 Minutes |
| H1 | 1 Hour |
| H4 | 4 Hours |
| D1 | Daily |
| W1 | Weekly |
| MN | Monthly |
This allows traders to compare short-term market conditions with longer-term trends.
For example, you may see:
M1 → BEAR
M5 → BEAR
M15 → BEAR
M30 → BEAR
H1 → BULL
H4 → BULL
D1 → BULL
W1 → BULL
MN → BULL
This would indicate that the lower timeframes are currently bearish while the higher timeframes remain bullish.
Such information can help traders understand the difference between short-term and longer-term market conditions.
Timeframe Bias
The Multi Timeframe Forex Trend Indicator calculates an overall bias for each timeframe.
Each timeframe can have up to six indicator readings.
For example:
H1
- RSI → BULL
- CCI → BULL
- EMA → BULL
- MACD → BEAR
- Bollinger Bands → BULL
- Envelopes → BULL
In this example, five indicators are bullish and one is bearish.
The H1 timeframe therefore receives an overall:
BULL
bias.
This calculation is repeated for all available timeframes.
Indicator Bias
The dashboard also calculates an overall bias for each individual indicator.
For example, the RSI may produce results across the nine timeframes such as:
- M1 → BULL
- M5 → BULL
- M15 → BULL
- M30 → BEAR
- H1 → BULL
- H4 → BULL
- D1 → BEAR
- W1 → BULL
- MN → BULL
The dashboard counts the bullish and bearish RSI readings and produces an overall RSI bias.
This makes it possible to see both:
Which timeframes are bullish or bearish?
and:
Which indicators are currently bullish or bearish?
Overall Market Consensus
The most important feature of the Multi Timeframe Forex Trend Indicator is its Market Consensus calculation.
The dashboard combines the active bullish and bearish signals and calculates a net bias score.
The result can fall into five categories.
| Net Bias Score | Result |
|---|---|
| +50% or higher | Strong Bullish Consensus |
| +15% to +49.9% | Bullish Consensus |
| -14.9% to +14.9% | Neutral Consensus |
| -15% to -49.9% | Bearish Consensus |
| -50% or lower | Strong Bearish Consensus |
For example, suppose the dashboard has:
40 bullish signals
and:
10 bearish signals
out of:
50 total signals
The net bias score would be:
+60%
The dashboard would therefore display:
STRONG BULLISH CONSENSUS
This makes it much easier to understand the overall technical direction without manually examining every indicator.
Bullish and Bearish Strength Bar
The dashboard also provides a visual bullish/bearish strength bar.
For example, if the active signals are:
70% Bullish
30% Bearish
the dashboard displays a larger bullish section and a smaller bearish section.
This provides a quick visual representation of the balance between bullish and bearish technical conditions.
The bar changes automatically as market conditions change.
Customize the Multi Timeframe Trend Indicator
The indicator isn’t locked to a fixed combination of timeframes and indicators.
You can choose which timeframes and indicators should participate in the analysis.
Disable Timeframes
You can turn individual timeframes OFF directly from the dashboard.
For example, you could disable:
- M1
- M5
- M15
if you are primarily interested in higher-timeframe trends.
Disabled timeframes are excluded from the consensus calculation.
Disable Indicators
You can also turn individual indicators OFF.
For example, you could use:
- RSI
- CCI
- EMA
- MACD
while disabling:
- Bollinger Bands
- Envelopes
This allows you to customize the analysis according to your own trading strategy.
Three Dashboard Sizes
The Multi Timeframe Forex Trend Indicator includes three panel sizes:
- Small
- Normal
- Large
You can select the size that works best with your monitor and chart layout.
The dashboard also uses a modern dark interface with different visual colors for bullish, bearish, neutral, and disabled conditions.
Does the Multi Timeframe Forex Trend Indicator Predict the Future?
No.
This is one of the most important things to understand about this indicator.
The Multi Timeframe Forex Trend Indicator does not predict where price will move in the future.
It does not know whether EURUSD, GBPUSD, XAUUSD, or another instrument will rise or fall tomorrow.
Instead, it analyzes current market data and shows the technical conditions that exist at the time of analysis.
For example, if the dashboard displays:
STRONG BULLISH CONSENSUS
it means that the selected technical indicators and timeframes are currently producing a predominantly bullish reading.
It does not mean:
“Price will definitely rise.”
Likewise, a Strong Bearish Consensus does not guarantee that price will continue falling.
The market can change direction at any time.
Economic news, central-bank decisions, geopolitical developments, unexpected events, liquidity changes, and other factors can all influence market prices.
Therefore, this indicator should be used as a market trend analysis and confirmation tool, not as a guaranteed prediction system.
How to Install the Multi Timeframe Forex Trend Indicator
The indicator is available for both MT4 and MT5.
- Download the correct MT4 or MT5 indicator file.
- Open your platform and go to File → Open Data Folder.
- Copy the indicator into the MQL4 → Indicators folder for MT4, or MQL5 → Indicators folder for MT5.
- Restart the platform or refresh the Navigator.
- Find the Multi Timeframe Forex Trend Indicator under Navigator → Indicators and drag it onto your chart.
That’s it. The dashboard will appear on your chart and start analyzing the current market trend.
Is the Multi Timeframe Forex Trend Indicator Free?
Yes. It is completely free to download and use.
The indicator is available for:
- MetaTrader 4
- MetaTrader 5
There is no subscription requirement and no monthly payment required to use the indicator.
It is offered as a free Forex technical analysis tool for traders who want to analyze market trends more efficiently.
Who Can Use This Forex Trend Indicator?
The Multi Timeframe Forex Trend Indicator can be useful for different types of Forex traders.
It may be useful for:
- Forex beginners
- Day traders
- Scalpers
- Swing traders
- Trend-following traders
- Multi-timeframe traders
- Technical analysts
- MT4 traders
- MT5 traders
The dashboard can be particularly useful for traders who regularly compare multiple timeframes before making a trading decision.
Forex Trading Risk Disclaimer
Forex trading involves substantial financial risk and may not be suitable for every trader.
The Multi Timeframe Forex Trend Indicator is provided for educational and informational purposes only.
The indicator analyzes current market data using technical indicators. It does not predict future prices, guarantee market direction, or guarantee profitable trading results.
A bullish, bearish, or neutral reading does not guarantee that the market will continue in the indicated direction.
Past performance and historical market behavior cannot guarantee future results.
Market prices can change rapidly because of economic releases, central-bank decisions, geopolitical events, market sentiment, liquidity conditions, and other unexpected factors.
Never trade with money you cannot afford to lose. Always consider your financial situation, trading experience, and risk tolerance before making trading decisions.
EA Trades and the developer of this indicator are not responsible for trading losses, financial losses, or damages resulting from the use or misuse of this indicator.
If you are unsure whether Forex trading is appropriate for you, consider seeking advice from a qualified financial professional.